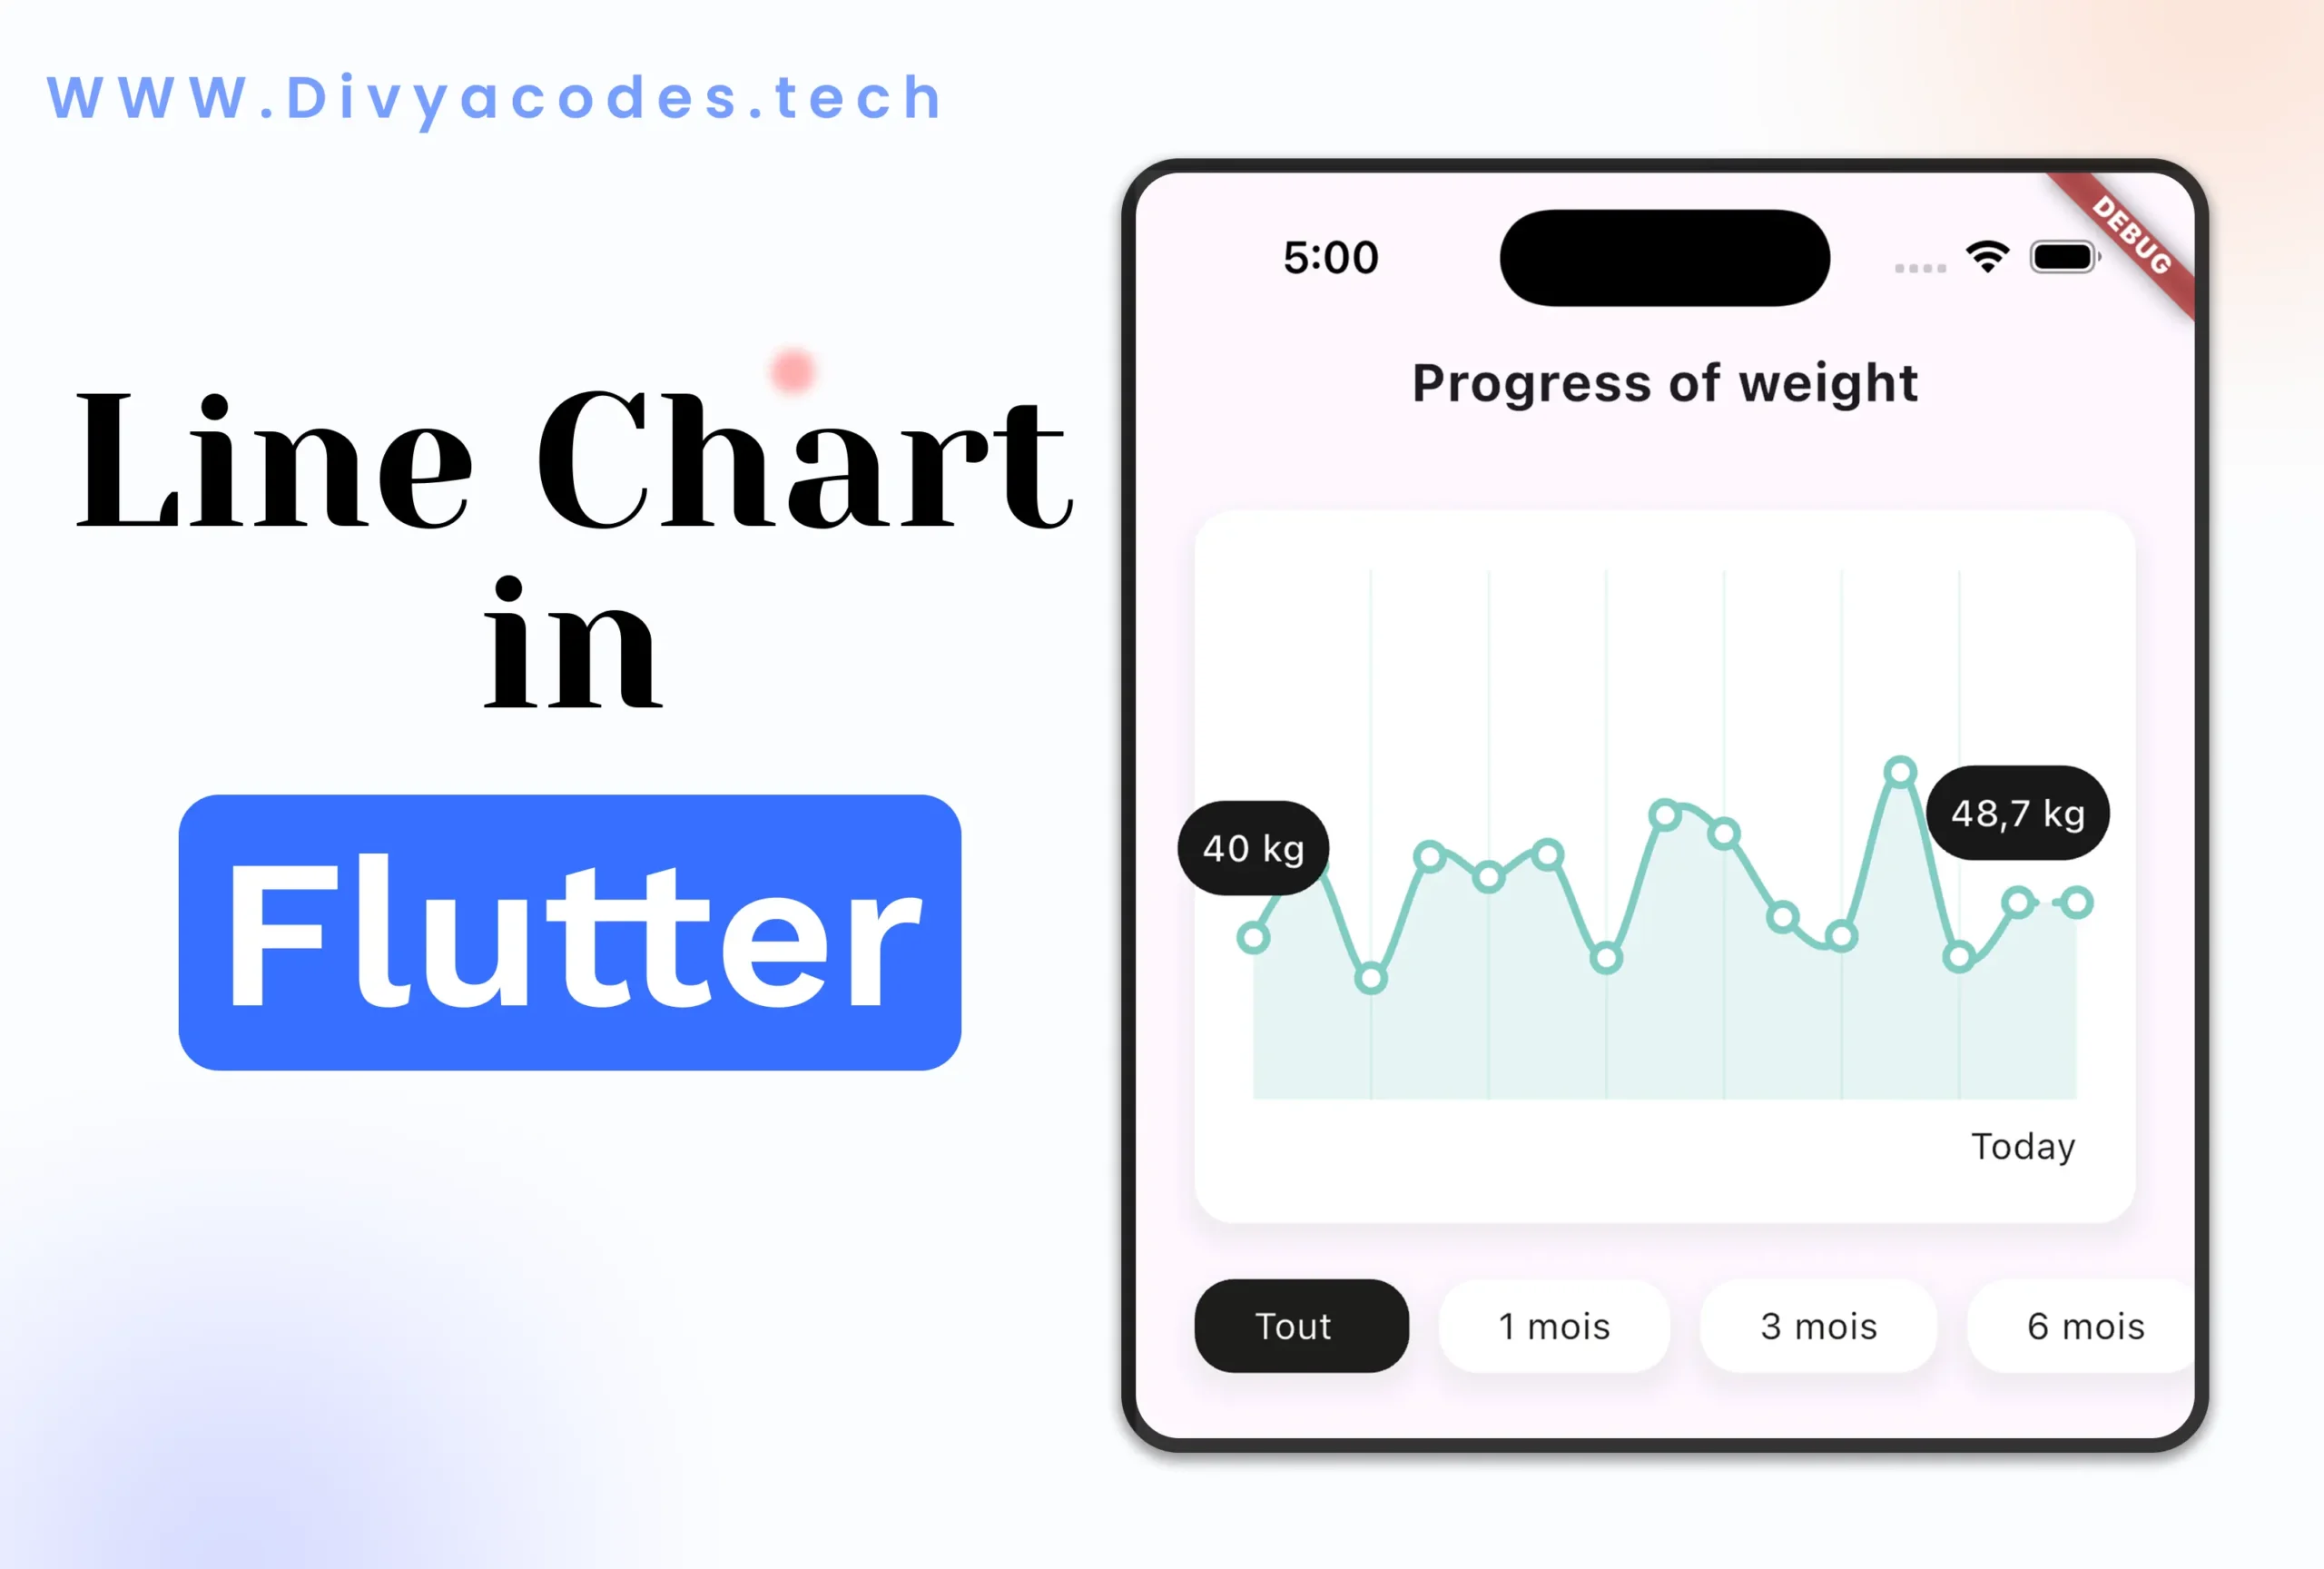
Line charts are a great way to visualize data trends, such as tracking weight, sales, or temperature changes over time. In Flutter, you can easily create visually appealing and interactive line charts using packages like fl_chart.
In this tutorial, you’ll learn how to create a line chart in Flutter from scratch with step-by-step instructions and code examples.
🚀 Why Use Line Charts in Flutter?
Line charts help:
- Show data trends over time
- Make insights easier to understand
- Enhance the user experience in fitness, finance, or productivity apps
Visualizing weight trends can be a powerful motivator in fitness apps. In this tutorial, we’ll show you how to build an interactive weight progress line chart using Flutter with fl_chart, GetX, and a custom filtering feature. You’ll learn how to set up the complete chart, bind it to dynamic data, and display weight history over selectable timeframes.
✅ What You’ll Learn
- Displaying weight data using a line chart (
fl_chart) - Filtering data by time (1 month, 3 months, etc.)
- Using
GetXfor state management - Creating a beautiful, interactive UI
🏗 Step 1: Project Setup
Start by adding dependencies:
yamlCopyEditdependencies:
  flutter:
    sdk: flutter
  get: ^4.6.6
  intl: ^0.19.0
  fl_chart: ^0.55.2
🖥 Step 2: Main Entry Point
import 'package:custom_view/weight_progress_view.dart';
import 'package:flutter/material.dart';

void main() {
  runApp(const WeightChartApp());
}

class WeightChartApp extends StatelessWidget {
  const WeightChartApp({super.key});

  @override
  Widget build(BuildContext context) {
    return MaterialApp(
      title: 'Progress Chart App',
      theme: ThemeData(primarySwatch: Colors.blue),
      home: WeightProgressScreen(),
    );
  }
}
📊 Step 3: Build the Main Screen UI
dartCopyEditclass WeightProgressScreen extends StatefulWidget {
  const WeightProgressScreen({super.key});

  @override
  State<WeightProgressScreen> createState() => _WeightProgressScreenState();
}

class _WeightProgressScreenState extends State<WeightProgressScreen> {
  final WeightProgressController _wightProgressController = Get.put(WeightProgressController());

  @override
  Widget build(BuildContext context) {
    Dimens().init(context);
    return Scaffold(
      body: SafeArea(
        child: Column(
          children: [
            // Title Section
            Padding(
              padding: EdgeInsets.only(bottom: 20),
              child: Text(
                'Progress of weight',
                style: TextStyle(fontWeight: FontWeight.w700, fontSize: 20),
              ),
            ),
            Expanded(
              child: SingleChildScrollView(
                child: Column(
                  children: [
                    const WeightChart(), // Custom Line Chart Widget
                    _filterGraphCardsView(), // Filter Options
                  ],
                ),
              ),
            ),
          ],
        ),
      ),
    );
  }

  Widget _filterGraphCardsView() {
    return Obx(() => ListView.separated(
          scrollDirection: Axis.horizontal,
          itemCount: _wightProgressController.monthSelectionItem.length,
          itemBuilder: (context, index) {
            final item = _wightProgressController.monthSelectionItem[index];
            return GestureDetector(
              onTap: () {
                for (var ele in _wightProgressController.monthSelectionItem) {
                  ele.isEnable = false;
                }
                item.isEnable = true;
                _wightProgressController.getMonthYearWiseData(item.title);
                _wightProgressController.monthSelectionItem.refresh();
              },
              child: Container(
                padding: EdgeInsets.symmetric(horizontal: 20),
                decoration: BoxDecoration(
                  color: item.isEnable ? Colors.blue : Colors.white,
                  borderRadius: BorderRadius.circular(15),
                  boxShadow: const [BoxShadow(color: Colors.black12, blurRadius: 4)],
                ),
                child: Center(
                  child: Text(
                    item.title,
                    style: TextStyle(
                      color: item.isEnable ? Colors.white : Colors.blue,
                    ),
                  ),
                ),
              ),
            );
          },
          separatorBuilder: (_, __) => SizedBox(width: 10),
        ));
  }
}
📈 Step 4: Chart Widget (WeightChart
This widget renders the line chart using fl_chart.
dartCopyEditclass WeightChart extends StatefulWidget {
  const WeightChart({super.key});

  @override
  State<WeightChart> createState() => _WeightChartState();
}

class _WeightChartState extends State<WeightChart> {
  final WeightProgressController _controller = Get.find()..init();

  @override
  Widget build(BuildContext context) {
    return Obx(() {
      return Container(
        margin: EdgeInsets.all(20),
        height: 300,
        decoration: BoxDecoration(
          color: Colors.white,
          borderRadius: BorderRadius.circular(15),
          boxShadow: [BoxShadow(color: Colors.black12, blurRadius: 6)],
        ),
        child: _controller.values.isNotEmpty
            ? Padding(
                padding: const EdgeInsets.all(20.0),
                child: LineChart(_buildChart()),
              )
            : const Center(child: Text('No Data')),
      );
    });
  }

  LineChartData _buildChart() {
    return LineChartData(
      lineTouchData: LineTouchData(
        enabled: true,
        touchCallback: (event, response) {
          if (response?.lineBarSpots?.isNotEmpty ?? false) {
            final spot = response!.lineBarSpots!.first;
            _controller.touchDate.value = _controller.data[spot.x.toInt()].date;
          }
        },
      ),
      maxX: _controller.maxX.value,
      minX: _controller.minX.value,
      maxY: _controller.maxY().value,
      minY: 0,
      lineBarsData: [
        LineChartBarData(
          isCurved: true,
          spots: _controller.values,
          barWidth: 3,
          color: Colors.blueAccent,
          belowBarData: BarAreaData(show: true, color: Colors.blue.withOpacity(0.2)),
        ),
      ],
      titlesData: FlTitlesData(show: false),
      gridData: FlGridData(show: true),
      borderData: FlBorderData(show: false),
    );
  }
}
🧠 Step 5: Controller with Dummy Data
dartCopyEditclass WeightProgressController extends GetxController {
  var values = <FlSpot>[].obs;
  var data = <GraphModel>[].obs;
  var touchDate = ''.obs;
  var minX = 0.0.obs;
  var maxX = 0.0.obs;

  final dummyData = [
    GraphModel(x: 0, y: 60.0, date: '2025-05-01'),
    GraphModel(x: 1, y: 59.0, date: '2025-05-15'),
    GraphModel(x: 2, y: 58.0, date: '2025-06-01'),
    GraphModel(x: 3, y: 57.5, date: '2025-06-15'),
    GraphModel(x: 4, y: 56.0, date: '2025-06-26'),
  ];

  RxList<MonthSelectionModel> monthSelectionItem = [
    MonthSelectionModel(title: 'Tout', isEnable: true),
    MonthSelectionModel(title: '1 mois'),
    MonthSelectionModel(title: '3 mois'),
    MonthSelectionModel(title: '6 mois'),
    MonthSelectionModel(title: '1 an'),
  ].obs;

  void init() {
    getMonthYearWiseData('Tout');
  }

  void getMonthYearWiseData(String title) {
    final now = DateTime.now();
    List<GraphModel> filtered;

    switch (title) {
      case '1 mois':
        filtered = dummyData.where((e) {
          return now.difference(DateTime.parse(e.date)).inDays <= 30;
        }).toList();
        break;
      case '3 mois':
        filtered = dummyData.where((e) {
          return now.difference(DateTime.parse(e.date)).inDays <= 90;
        }).toList();
        break;
      default:
        filtered = dummyData;
    }

    data.value = filtered;
    values.value = filtered
        .asMap()
        .entries
        .map((entry) => FlSpot(entry.key.toDouble(), entry.value.y))
        .toList();
    minX.value = 0;
    maxX.value = values.isNotEmpty ? values.last.x + 1 : 1;
  }

  RxDouble maxY() {
    if (values.isEmpty) return 100.0.obs;
    final maxVal = values.map((e) => e.y).reduce((a, b) => a > b ? a : b);
    return (maxVal + 10).obs;
  }
}
📦 Supporting Models
dartCopyEditclass GraphModel {
  final double x;
  final double y;
  final String date;

  GraphModel({required this.x, required this.y, required this.date});
}

class MonthSelectionModel {
  String title;
  bool isEnable;

  MonthSelectionModel({required this.title, this.isEnable = false});
}
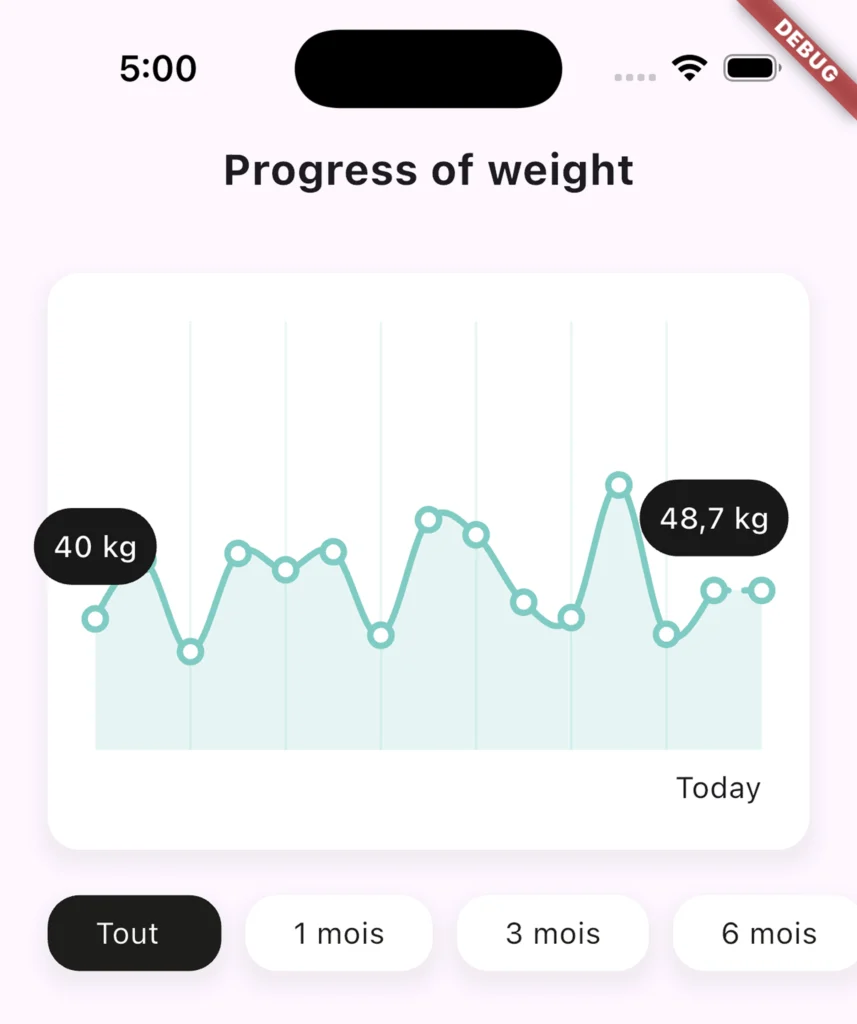
🎯 Final Output
You now have a fully functional weight progress chart that:
- Updates based on date filters
- Animates and shows tooltips
- Uses GetX for reactive state
- Can be extended with user input and local storage
📝 Conclusion
With Flutter, building beautiful and interactive charts is both fast and flexible. By combining fl_chart with GetX, we created a powerful tool for visualizing progress — ideal for fitness, health, finance, or habit-tracking apps.